Tunbridge Wells Borough has recorded another record rate of new Covid-19 cases, although the latest rise was less than previous days suggesting cases may be nearing a peak as tougher restrictions and school holidays have an effect in reducing transmission.
It is not clear whether full testing and reporting will be in place over Christmas, so this blog will cease tracking the figures for the next week until reporting gets back to normal.
In some more apparently good news, the figures for the three of the worst hit Kent Boroughs (Swale, Medway and Maidstone) fell in the latest weekly reporting period from the day before.
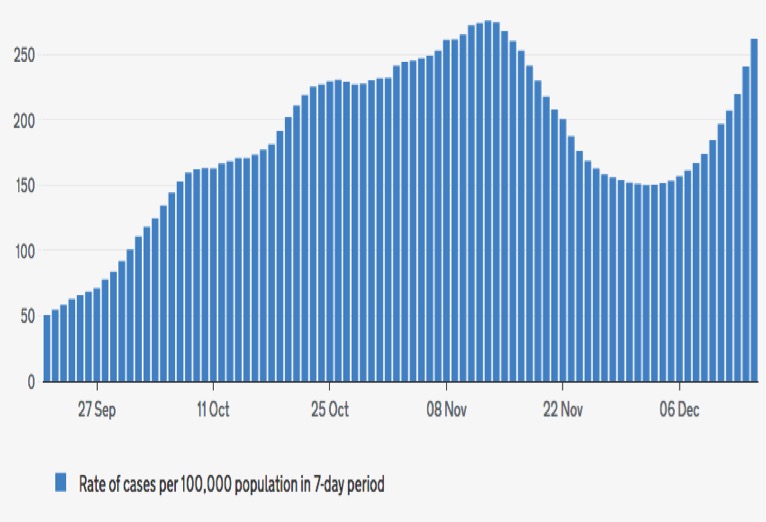
The weekly Tunbridge Wells Borough case rate fell back to just 78 per 100,000 of population on 24th November, but in the month since then has sadly climbed back up – to a new record rate of 454 cases per 100,000 people over the week to December 19th, which is the latest data available.
The rate in Tunbridge Wells Borough is 35% above the England average. The Tonbridge and Malling Borough case rate is more than twice the England average.
Meanwhile, the latest concern is a new Covid-19 variant discovered in South Africa that appears to be making younger people sicker compared with the original virus.
On Wednesday, it was announced that the areas of Sussex that border Tunbridge Wells would move up from Tier 2 to join the Tier 4 restrictions on Boxing Day.
Here are the latest numbers: (NB slide the display to see all 7 columns of numbers or view in landscape).
| Aug 1 | Oct 1 | Nov 1 | Nov 14 | Dec 17 | Dec 18 | Dec 19 | ||
| Tun Wells | 6 | 21 | 53 | 119 | 407 | 436 | 454 | Tun Wells |
| Tonbridge | 3 | 17 | 91 | 202 | 654 | 679 | 683 | Tonbridge |
| Sevenoaks | 3 | 23 | 99 | 197 | 475 | 496 | 528 | Sevenoaks |
| Wealden* | 5 | 13 | 48 | 125 | 327 | 357 | 367 | Wealden* |
| Swale | 11 | 22 | 203 | 619 | 952 | 921 | 884 | Swale |
| Maidstone | 6 | 11 | 123 | 236 | 759 | 768 | 752 | Maidstone |
| Medway | n/a | 21 | 144 | 318 | 1,045 | 1,077 | 1,064 | Medway |
| Bromley | 3 | 34 | 98 | 160 | 596 | 666 | 699 | Bromley |
| Rother^ | 0 | 43 | 44 | 132 | 603 | 634 | 656 | Rother^ |
| Hastings | 2 | 34 | 41 | 94 | 897 | 962 | 977 | Hastings |
| Aug 1 | Oct 1 | Nov 1 | Nov 14 | Dec 17 | Dec 18 | Dec 19 | ||
| Oxford | 14 | 133 | 139 | 249 | 274 | 295 | 310 | Oxford |
| Southmptn | 2 | 35 | 170 | 228 | 177 | 195 | 216 | Southmptn |
| Bristol | 4 | 43 | 407 | 488 | 157 | 165 | 164 | Bristol |
| Nottinghm | 8 | 412 | 377 | 263 | 214 | 228 | 229 | Nottinghm |
| Cardiff | 2 | 120 | 306 | 160 | 697 | 697 | 702 | Cardiff |
| Cambridge | 4 | 20 | 147 | 274 | 197 | 200 | 200 | Cambridge |
| ENGLAND | n/a | 101 | 232 | 275 | 306 | 326 | 336 | ENGLAND |
| WALES | n/a | 102 | 287 | 184 | 649 | 639 | 635 | WALES |
The figures above are confirmed cases per 100,000 of population in the previous 7 days, dated to when the test was taken.
*Wealden District includes Crowborough & Frant plus the Sussex bit of Groombridge– still in Tier 2 until Boxing Day when moves to Tier 4
^ Rother District Council includes Ticehurst & Hurst Green – also now in Tier 4
All statistics are sourced directly from:
https://coronavirus.data.gov.uk/